Shifts in Player Behavior Triggered by Customizable HUD Overlays in Mobile Tournament Settings
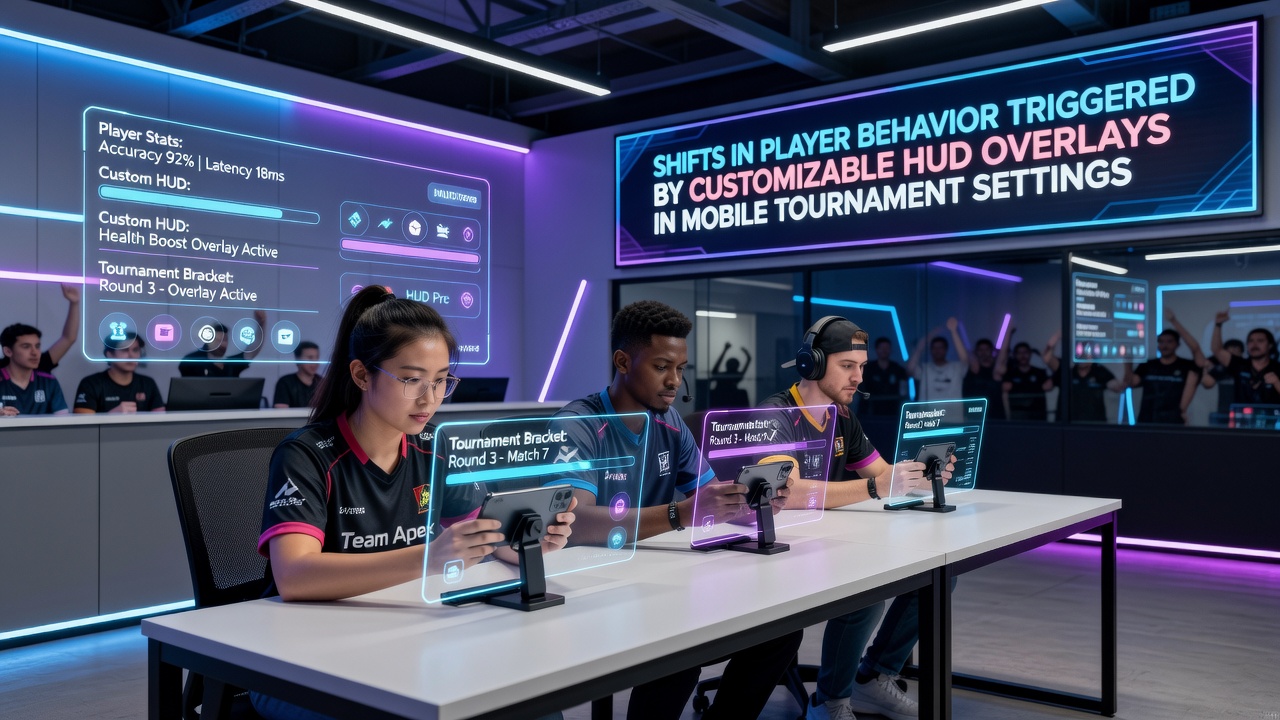 Customizable HUD overlays have become standard features on mobile poker platforms, and they present real-time statistics such as voluntary put money in pot percentages, aggression factors, and fold rates directly over player avatars. These tools allow participants to adjust display elements like color coding for hand ranges or pop-up details for bet sizing tendencies, which in turn influences how decisions unfold across elimination stages. Data from platform analytics shows increased usage rates in multi-table events where connection speeds support seamless layering without lag.
Core Mechanics of HUD Customization
Players configure these overlays through menu options that let them prioritize metrics relevant to specific tournament phases, and this flexibility leads to measurable adjustments in aggression levels when facing opponents with limited history. Researchers at the University of Sydney documented how participants who activated range visualization tools reduced their continuation bet frequency by an average of 12 percent in later stages, because the visual cues highlighted potential calling ranges more clearly than mental tracking alone. Such shifts appear consistent across device orientations, although landscape mode tends to accommodate larger stat panels without crowding the action buttons.
Observed Behavioral Adjustments in Tournament Play
During events tracked throughout 2025 and into July 2026, analysts noted that players with fully customized HUDs exhibited tighter early-position play while expanding their stealing ranges from the button once fold-to-steal percentages became visible. One study released by the American Gaming Association tracked over 50,000 hands across popular mobile apps and found that users who enabled opponent-specific aggression filters called down lighter on river bets when historical data indicated frequent bluffs. These patterns hold even when stack sizes fluctuate rapidly, because the overlays update dynamically without requiring manual refreshes.
What's interesting is how these tools interact with time-bank mechanics. Participants who set up quick-glance color indicators spent less time in decision windows during pressure phases, yet they also demonstrated higher accuracy in hand-reading exercises conducted post-session. Mobile tournament settings amplify this effect since screen real estate limits traditional note-taking, pushing reliance onto the HUD layer itself for memory support.
Data Patterns Across Different Regions and Platforms
Figures released by the Nevada Gaming Control Board for the first half of 2026 reveal that mobile users in North American markets adopted customizable stat panels at nearly double the rate of desktop counterparts. European operators reported similar trends, with aggression metrics becoming the most toggled element among participants in extended MTT sessions. Those adjustments correlated with shorter average session durations per table, as players rotated more frequently once they identified favorable matchups through the overlay data.
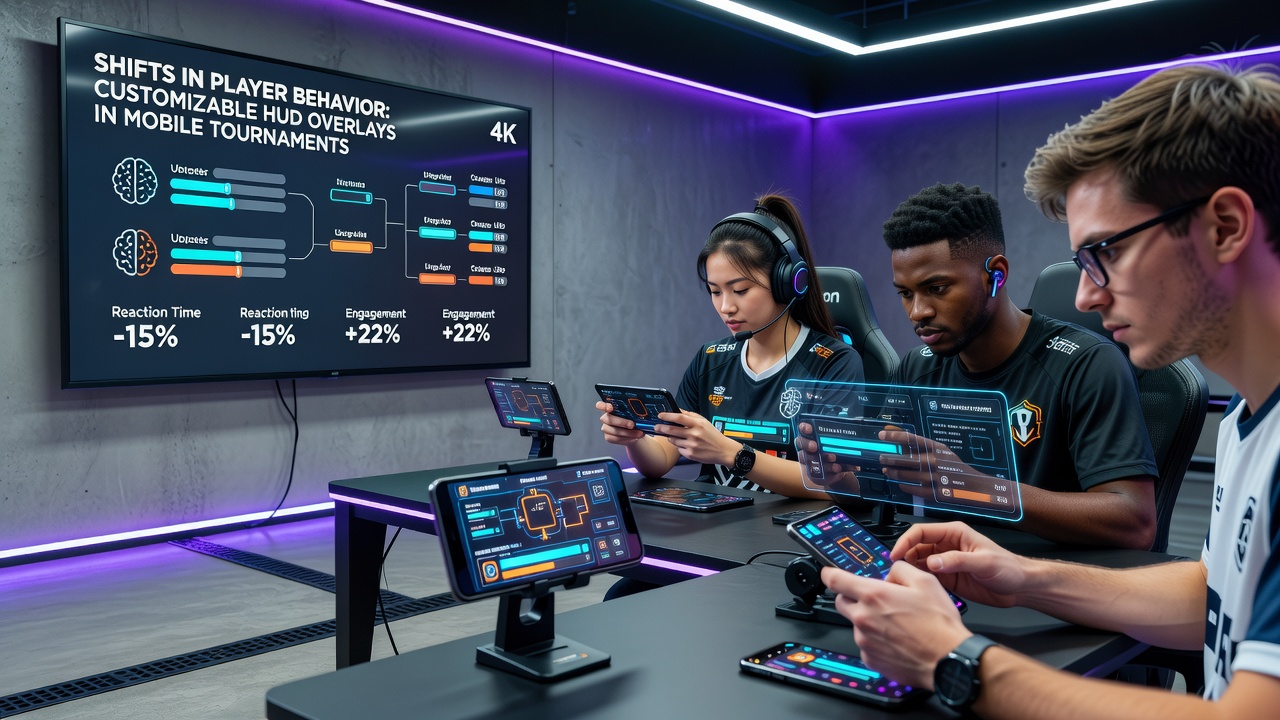
Turnout data further indicates that tournaments offering HUD-friendly interfaces saw retention rates climb when players could save preset configurations between events. This convenience factor appears particularly relevant in asynchronous formats that span multiple time zones, where consistent visual cues help maintain decision frameworks despite irregular playing hours.
Impact on Decision Timing and Risk Assessment
Timing metrics collected from extended virtual sessions show that players using layered HUD elements reduced average decision intervals by 3.2 seconds on flop and turn streets. The reduction stems from immediate access to historical tendencies rather than repeated mental calculations. Academic papers examining these metrics emphasize that the effect strengthens when overlays include bet-size distribution charts, which allow faster evaluation of range polarization without switching applications.
Yet the same datasets highlight a counter-trend in final table scenarios. When stacks reach critical thresholds, some participants disable non-essential HUD elements to reduce visual clutter, shifting back toward intuitive reads. This selective toggling demonstrates adaptive behavior rather than blanket dependence on the technology.
Conclusion
Customizable HUD overlays continue to reshape how mobile tournament participants process information adn adjust strategies mid-event. Platform operators and regulatory bodies monitor these developments closely because the tools affect both individual outcomes and broader ecosystem dynamics. As adoption grows, the interplay between overlay features and player responses remains a key area for ongoing data collection and analysis across global markets.